Immersive data visualizations
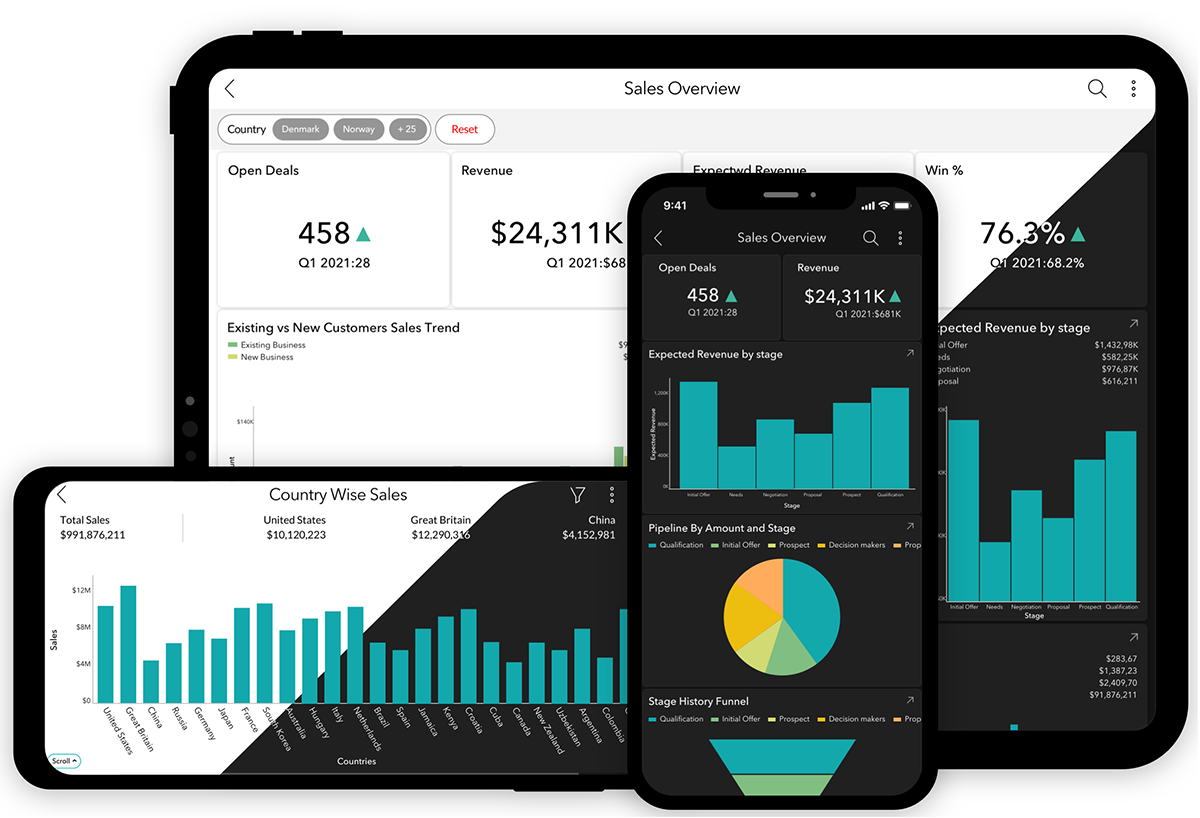
Experience your data in a new way with a wide array of charts, pivot tables, KPI widgets, and dashboards. Navigate through your data with a user-friendly touch interface.
- Dynamic charts and graphs: Choose from a variety of charts, line charts, pie charts, and more to represent your data visually.
- Interactive dashboards: Create and customize your dashboards by reordering and resizing and get a comprehensive view of your business metrics.
Interactive gestures
Leverage the power of touch to explore your data in engaging ways. Use simple gestures to interact with your data seamlessly.
- Touch navigation: Tap, swipe, pan, etc., to navigate through your data with ease.
- Drill down: Tap on charts and widgets to drill down into detailed data views.
Conversational analytics with Zia
Zia, your AI-powered data assistant, understands your data queries with detailed reports and visuals.
- Voice and text interaction: Ask questions naturally using voice or text.
- Instant insights: Get quick and relevant answers in intuitive report manners.
Self-organized visualizations
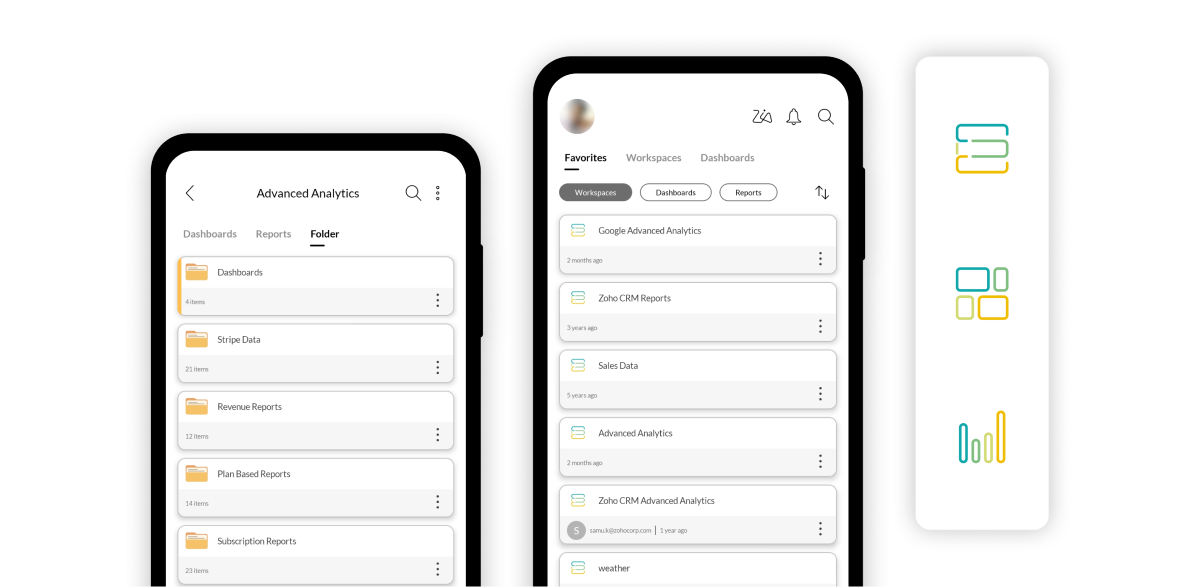
The Zoho Analytics - Mobile BI app organizes reports and dashboards automatically, and allows you to mark favorites for quick access.
- Automatic organization: Categorize reports by type, folders, and relationships.
- Favorites: Access important reports quickly with a single tap.

Collaboration over phone
Collaborate seamlessly with your team by sharing insights and dashboards, and setting permissions to control access.
- Role-based sharing: Share reports with specific team members with a fine-tuned access control.
- Commenting: Add comments to reports and dashboards to facilitate discussions and drive decisions.
Do more with the Zoho Analytics - Mobile BI app
Analyze business performance
Get notified at an instant for any critical changes and insights as they happen.
Better understand your data
Receive real-time updates on dashboards and reports.
Grow your business
Connect to cloud services, databases, spreadsheets, and more.
